

MASTR · CRYPTO & WEB3
DeFi’s expansion: pooled liquidity, collateral and rented activity
Automated markets and token incentives changed how users could provide capital, and made headline growth harder to interpret.
Los capítulos y gráficos técnicos están en inglés. La navegación está disponible en siete idiomas.
Is a protocol earning durable demand, or temporarily paying for it?
Markets became programmes
An automated market maker can quote a trade using assets held in a smart contract and a pricing rule. Liquidity providers supply inventory and bear the resulting exposure. Traders interact with the pool instead of waiting for an individually matched order. This changed who could supply liquidity, but it did not remove inventory risk, fees, arbitrage or adverse selection. A pool’s quoted price is a marginal price, not a promise that every holder can sell at it.
Collateral created an interconnected stack
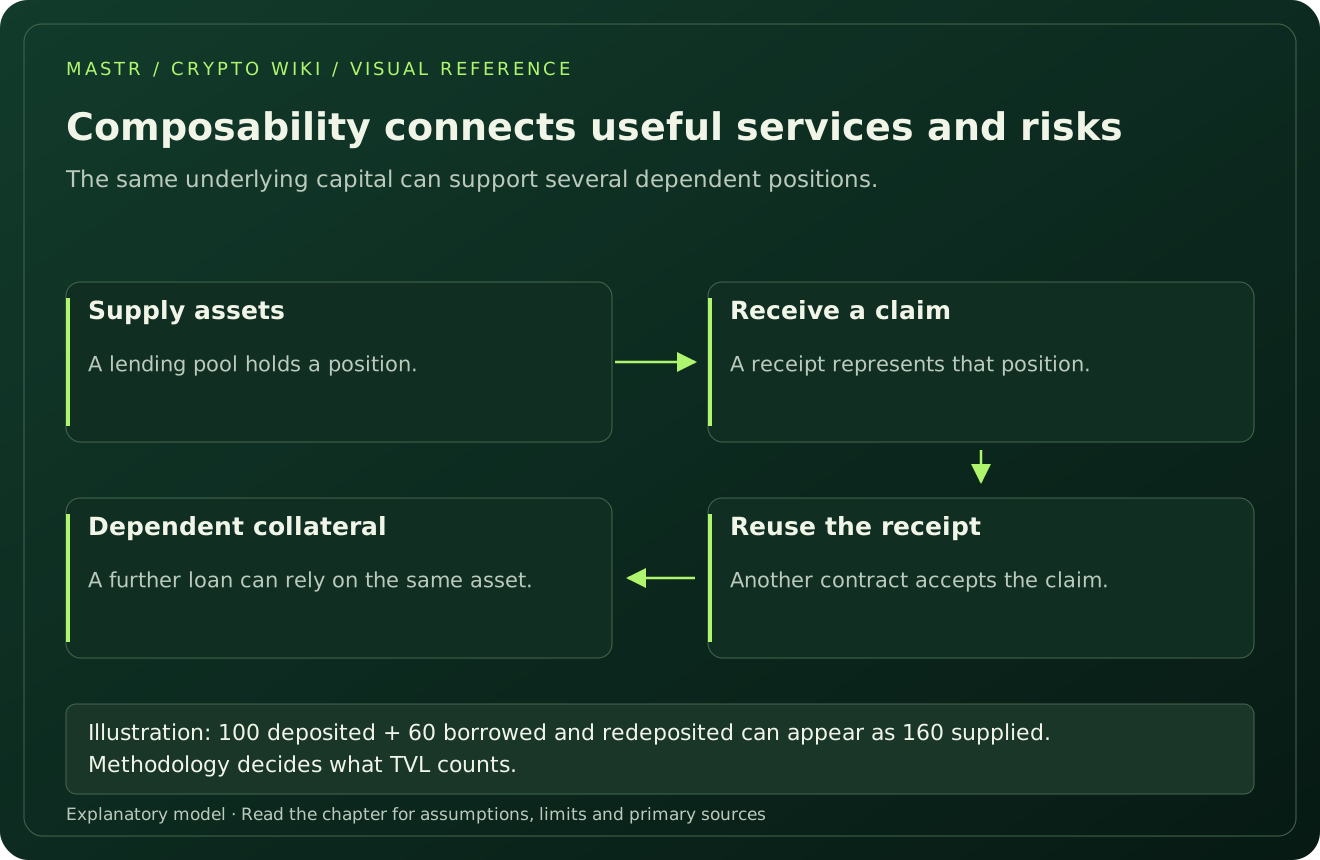
A lending market checks borrowing capacity against collateral using parameters and price inputs. It must also handle liquidations when a position breaches its limits. Receipt tokens can represent supplied assets, creating reusable claims that other applications may accept. This is useful composability, but a receipt is not an independent pile of money. Counting the same underlying asset at every layer can overstate the amount of distinct capital in a system.
Liquidity mining changes the reason to participate
Token rewards can attract users who want the reward more than the underlying service. Participation may be rational while emissions are valuable, then disappear when rewards fall or new programmes pay more. The relevant historical lesson from DeFi’s growth is not that all incentives are fake. It is that subsidised activity and self-sustaining demand need different measurements. Retention after incentives change is often more informative than the launch-week peak.
A yield has a payer
Interest can come from borrowers. Trading fees can come from users. Token emissions can transfer newly issued or treasury-held tokens to participants. These income sources have different economic costs. A displayed annualised percentage can combine them while also assuming reinvestment and a token price that will not remain constant. Identify the units, period and source of the return before comparing two products.
Read growth with a balance-sheet mindset
Ask whether deposits are borrowed, recursively supplied, rehypothecated or counted through several receipt tokens. Separate gross fees from protocol revenue and both from what liquidity providers actually keep. Describe smart-contract, oracle and collateral risks separately. A high utilisation figure can mean demand for borrowing, but it can also mean that immediately withdrawable liquidity is scarce. One headline cannot describe the entire position.
Ejemplo explicado
A user deposits 100 units, borrows 60 and deposits those 60 into another counted pool. Two dashboards may show 160 of supplied value even though the initial outside capital was 100. This illustration is not a claim that every TVL dataset counts recursively; it shows why methodology matters.
Preguntas para recordar
- Name the payer of each yield component.
- Separate outside capital from recursive claims.
- Compare retention after incentives change.